ABOUT GTD USING GTD DOWNLOAD GTD RESEARCH FAQ TERMS OF USE
RESEARCH
SELECTED PUBLICATIONS | DATA VISUALIZATIONS | PRESENTATIONS | GTD IN THE NEWS ↗ | GTD IN RESEARCH ↗
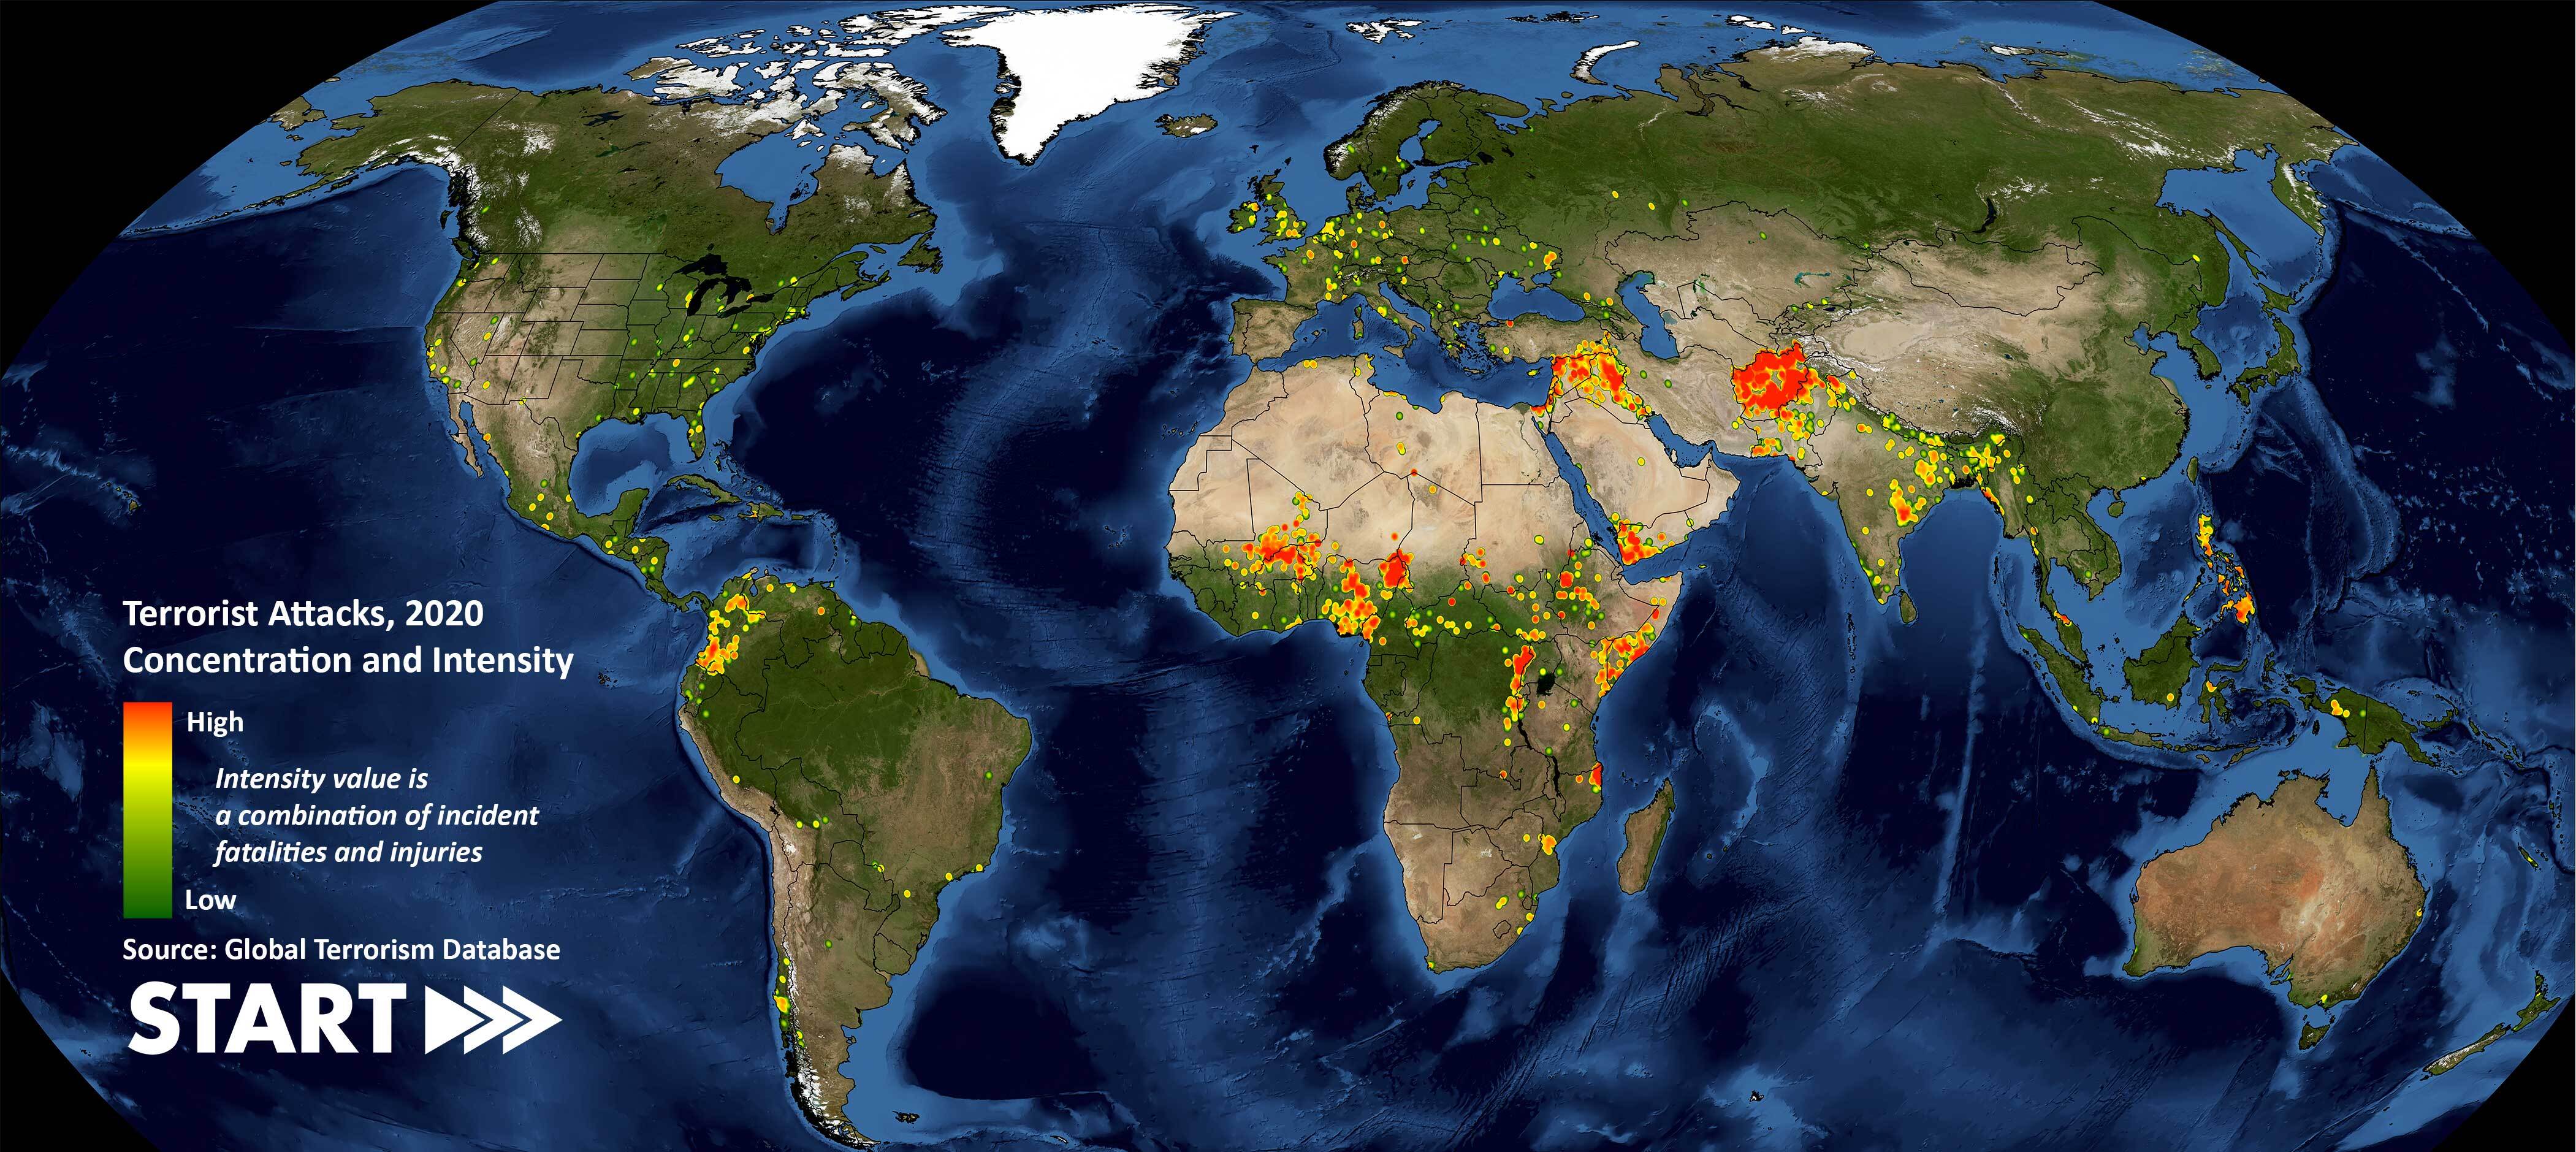
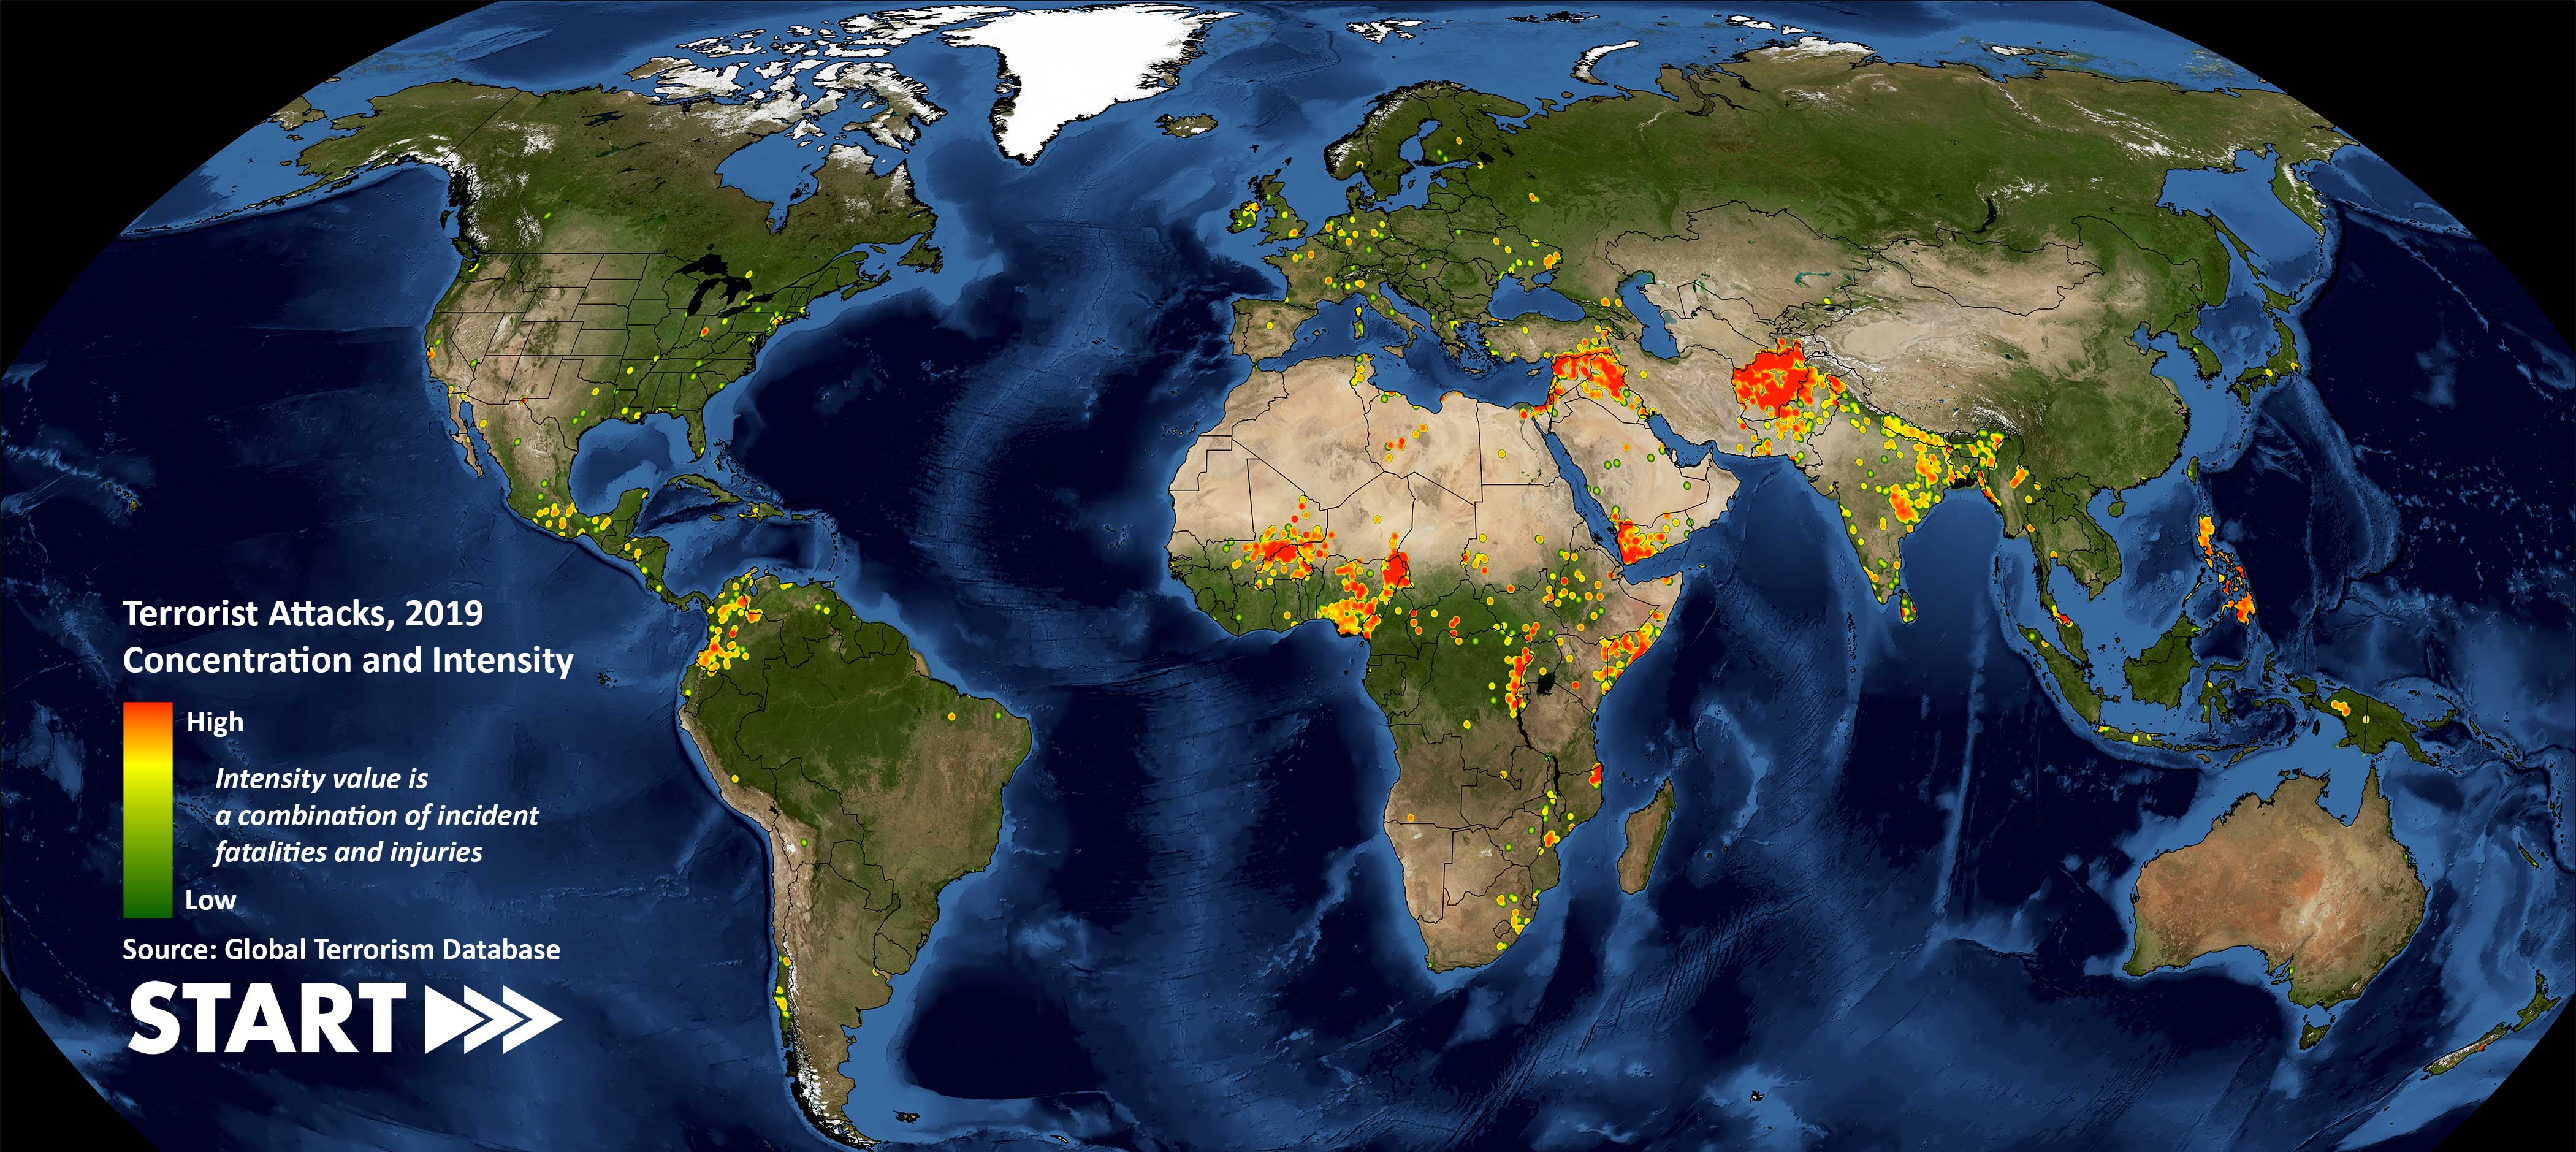
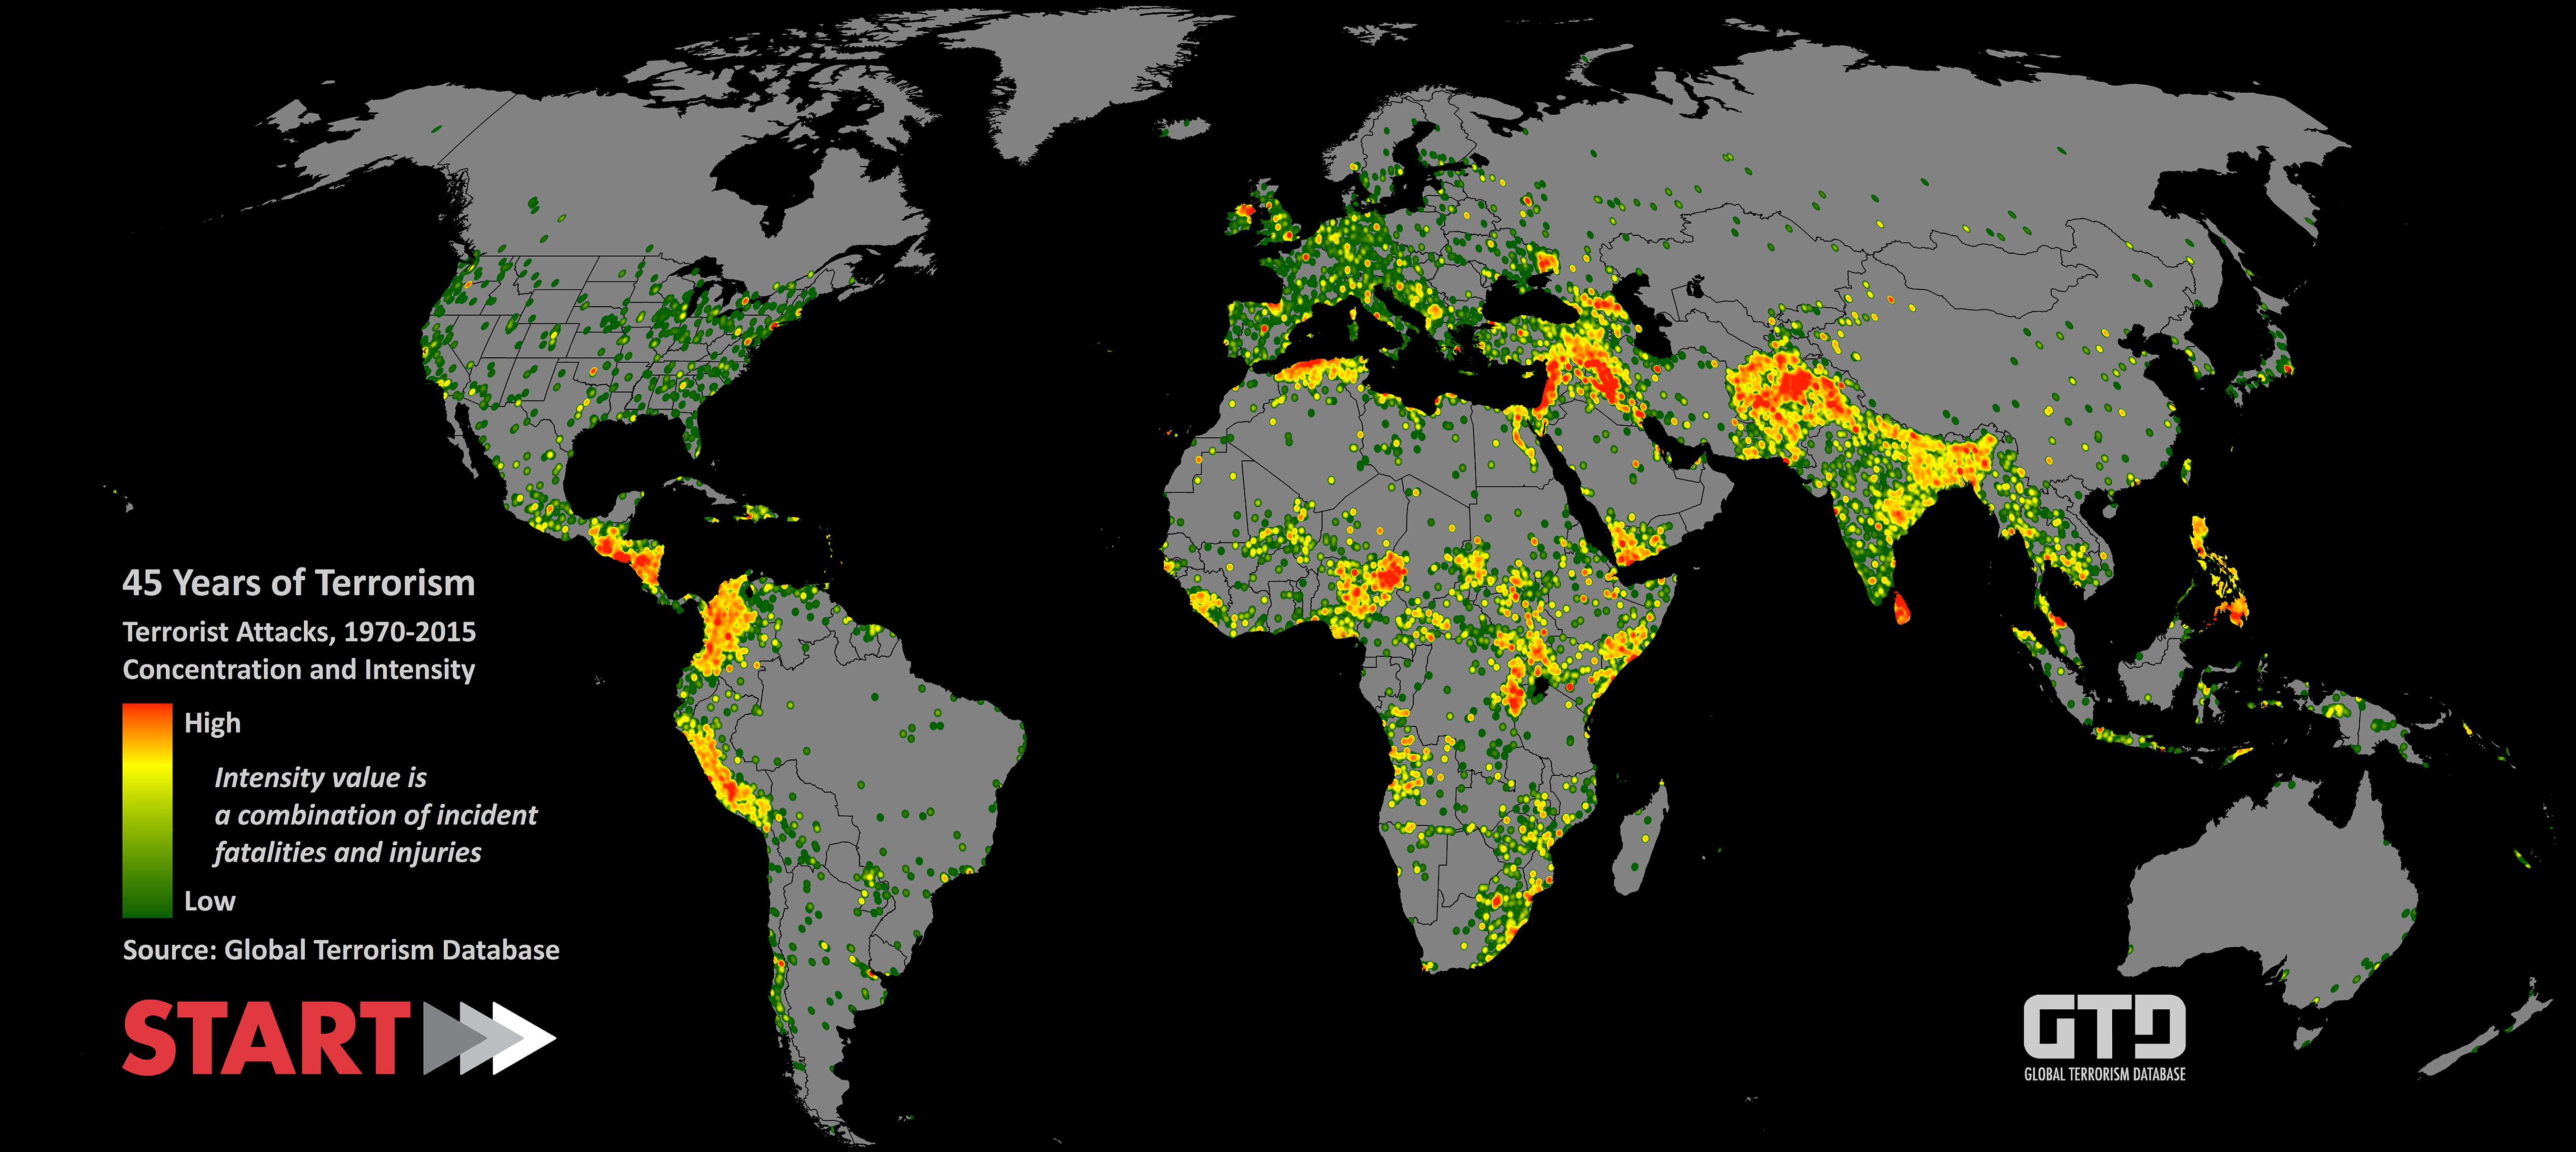
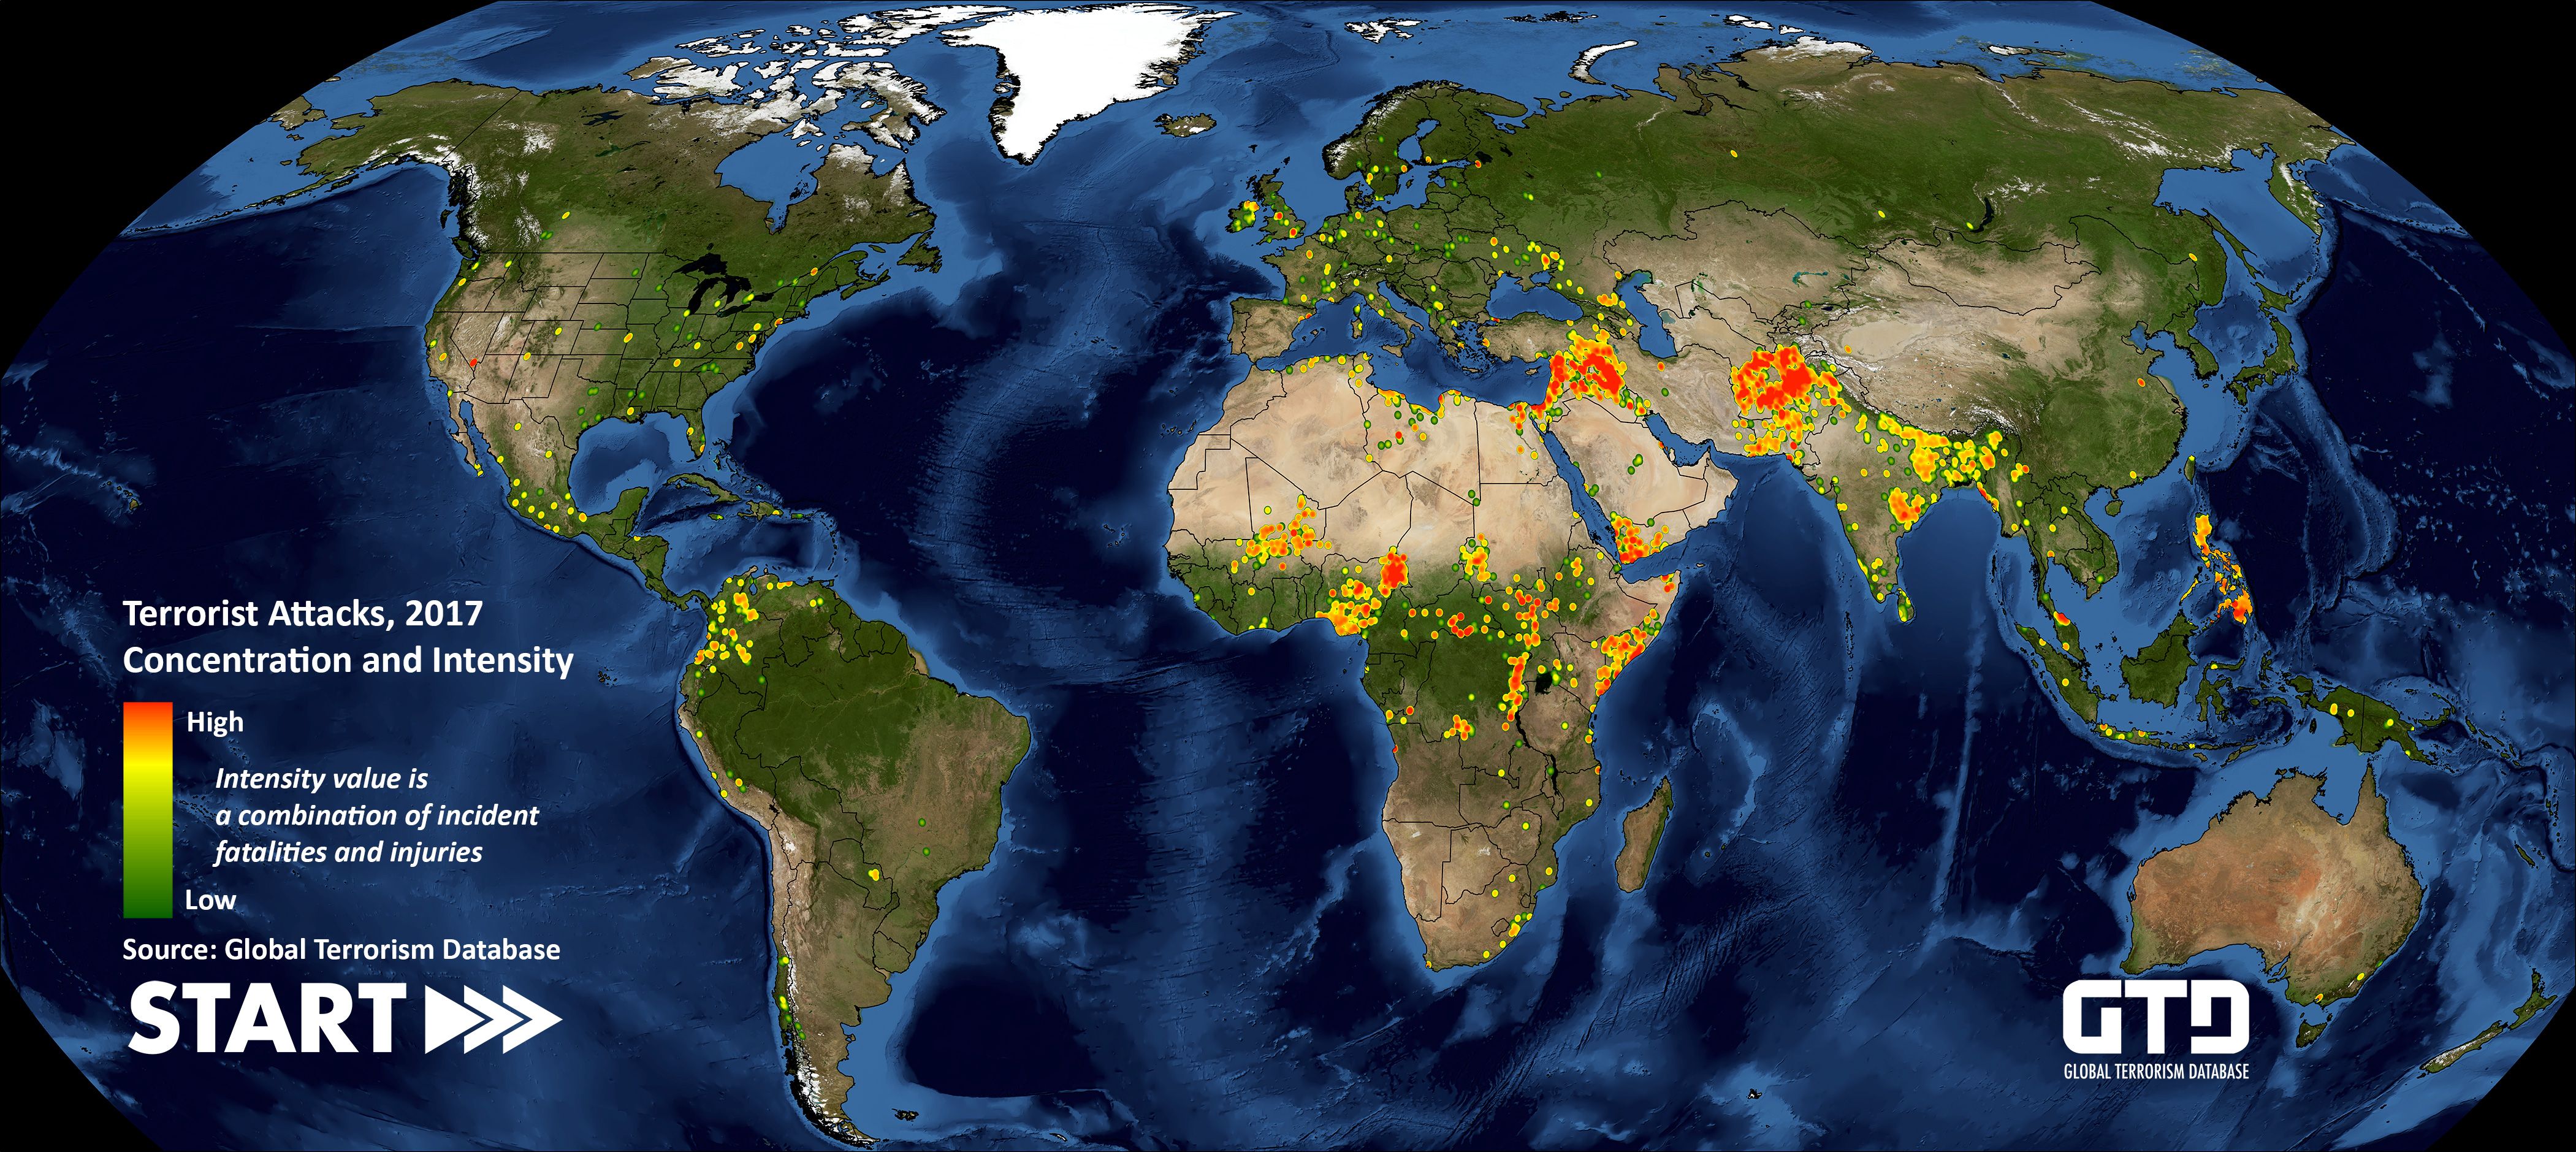
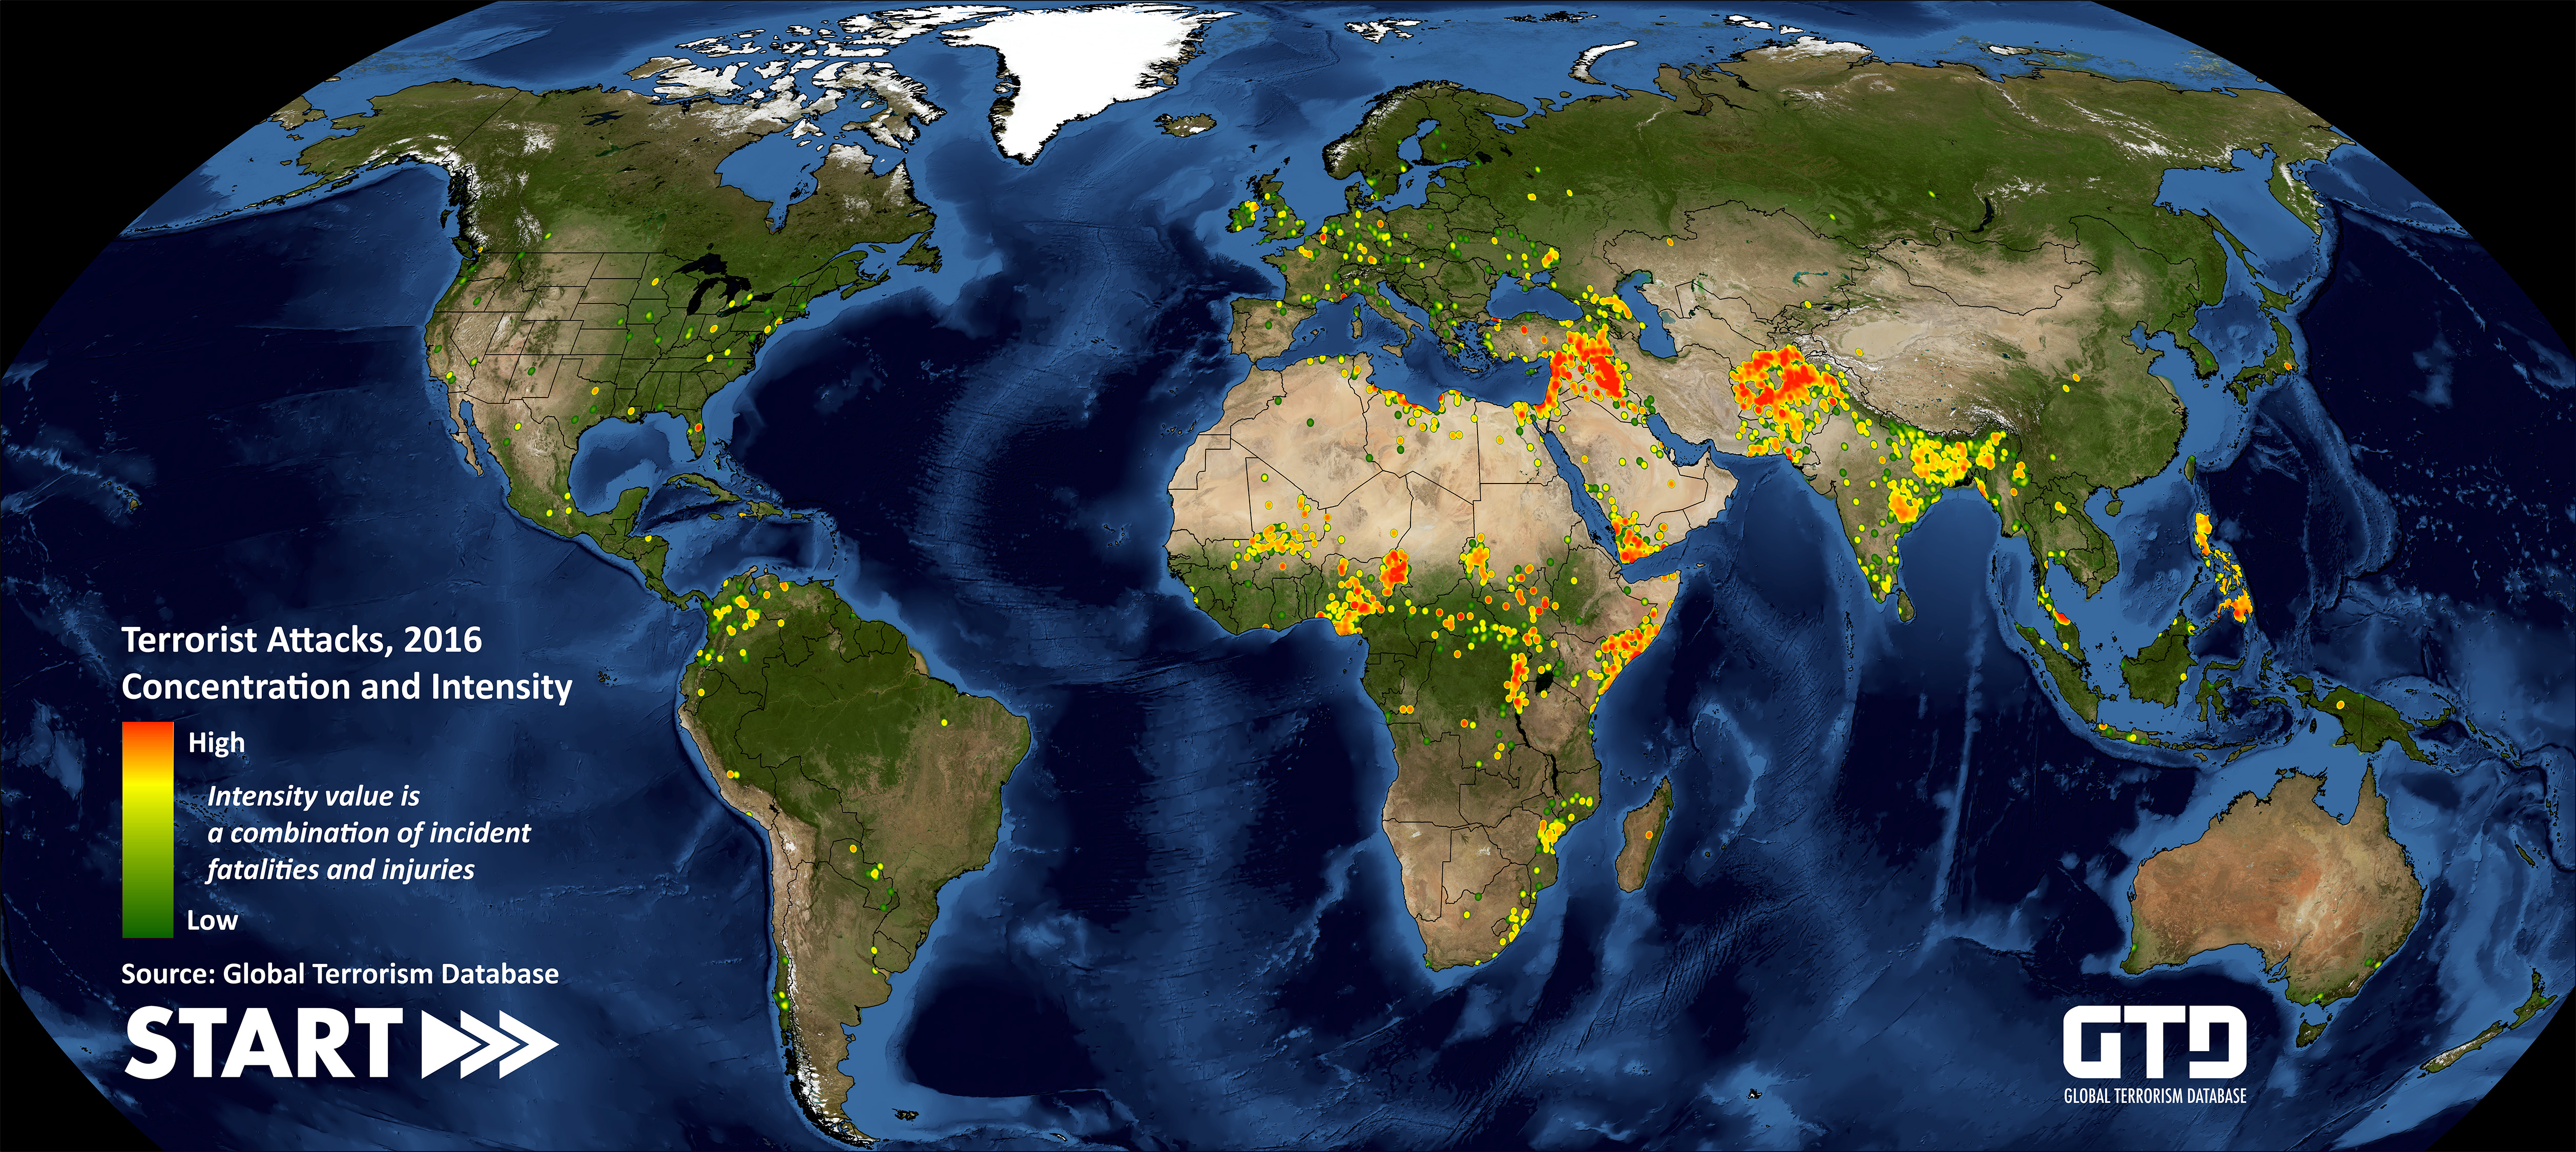
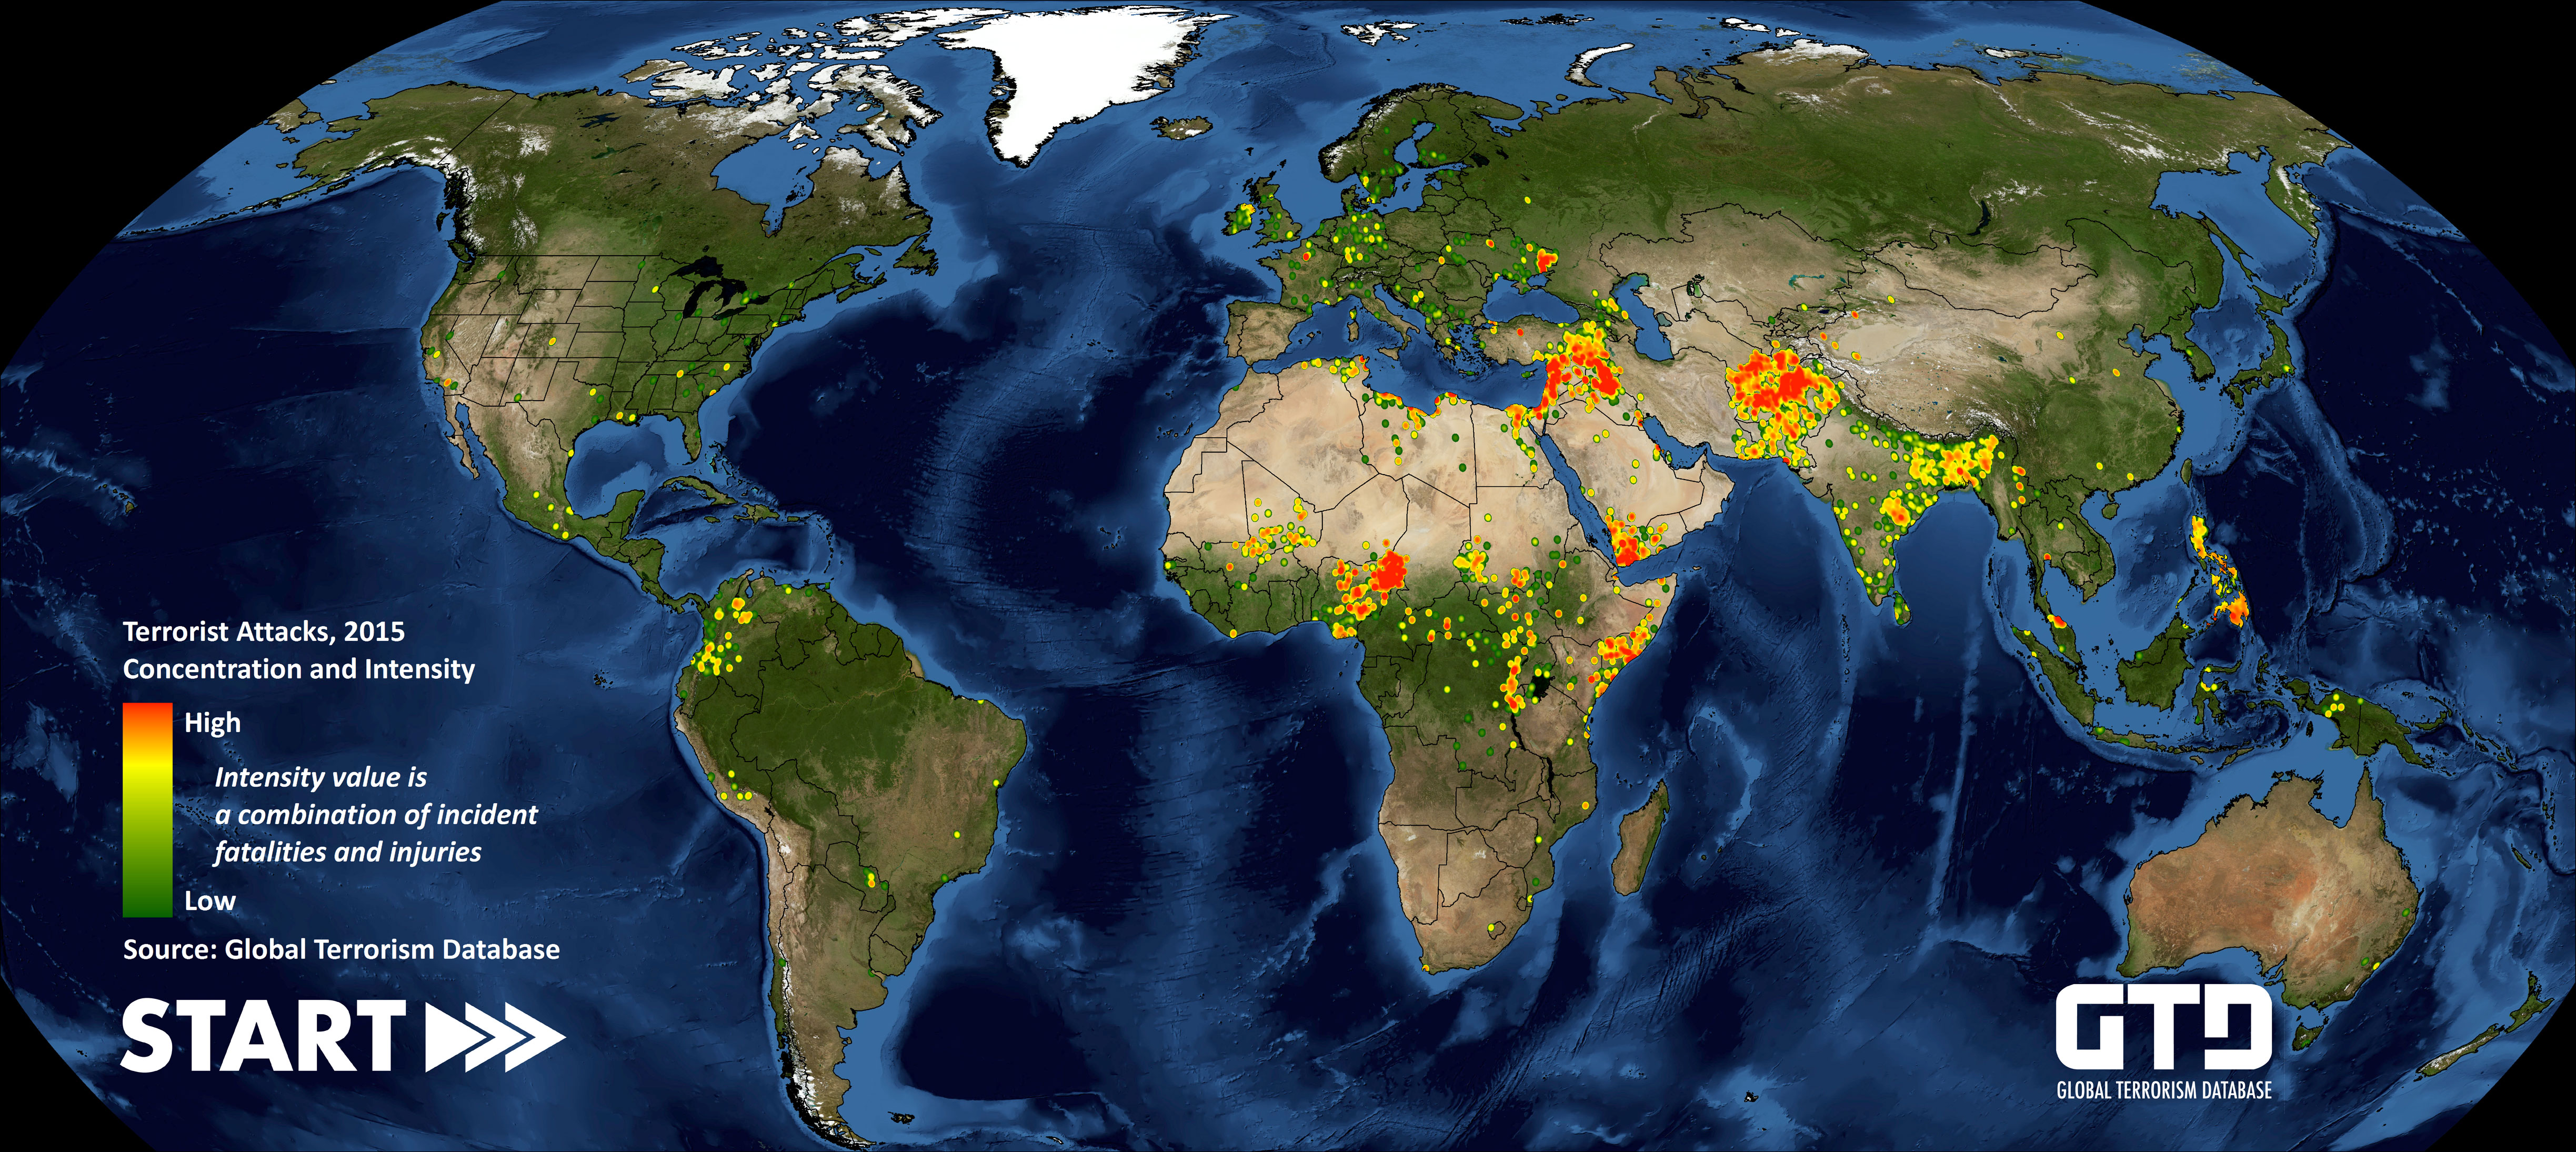
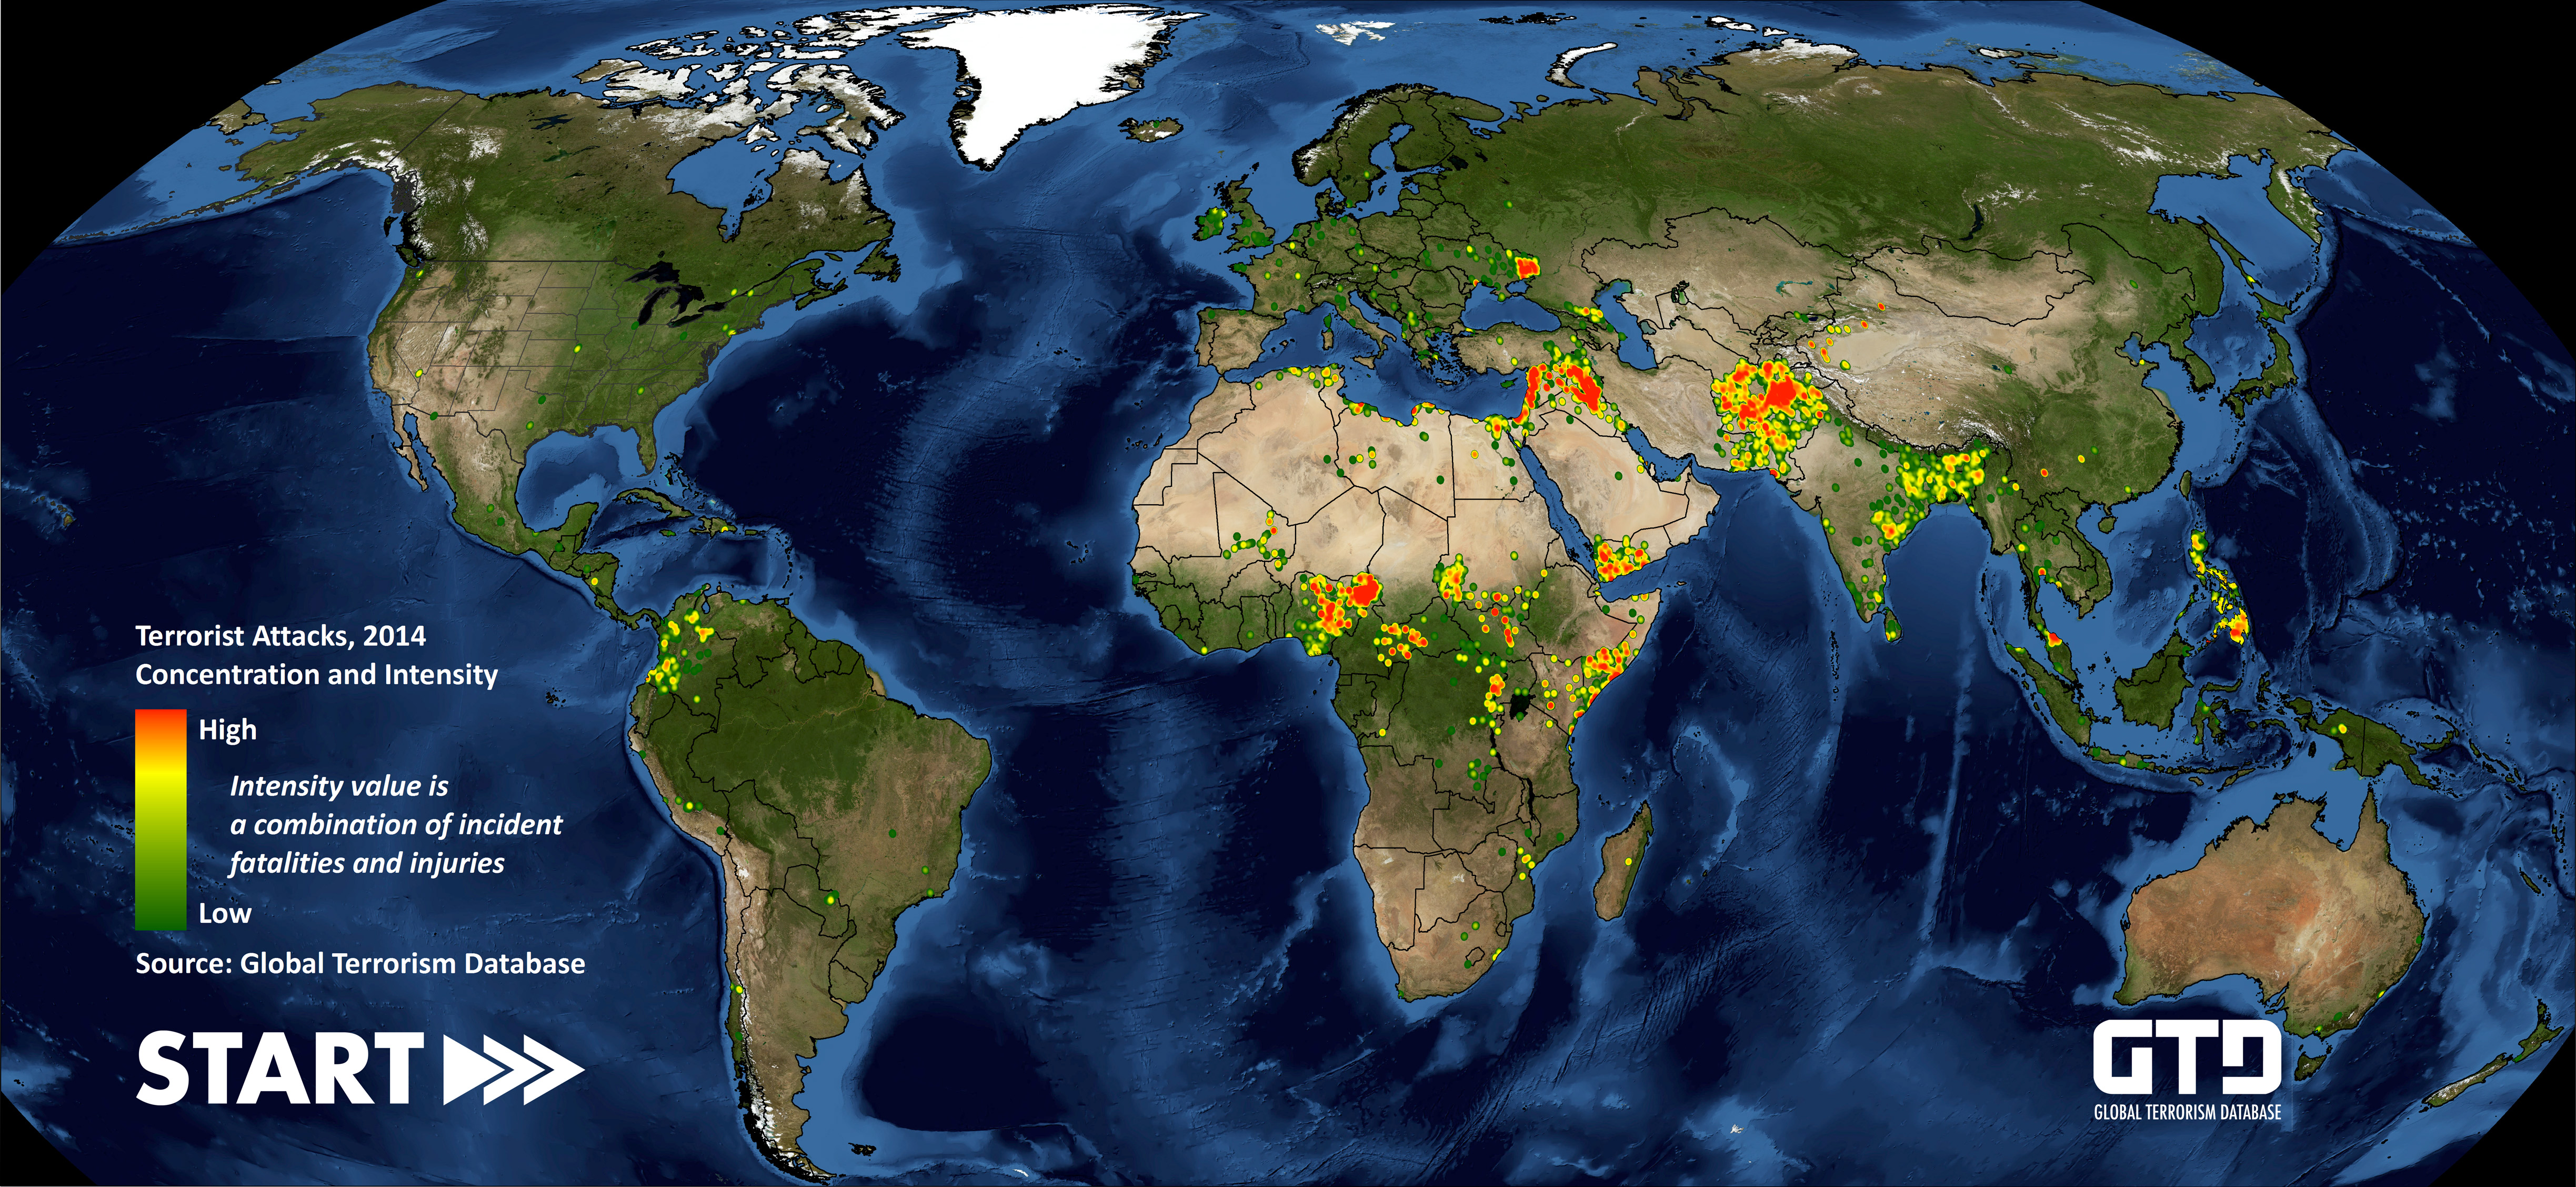
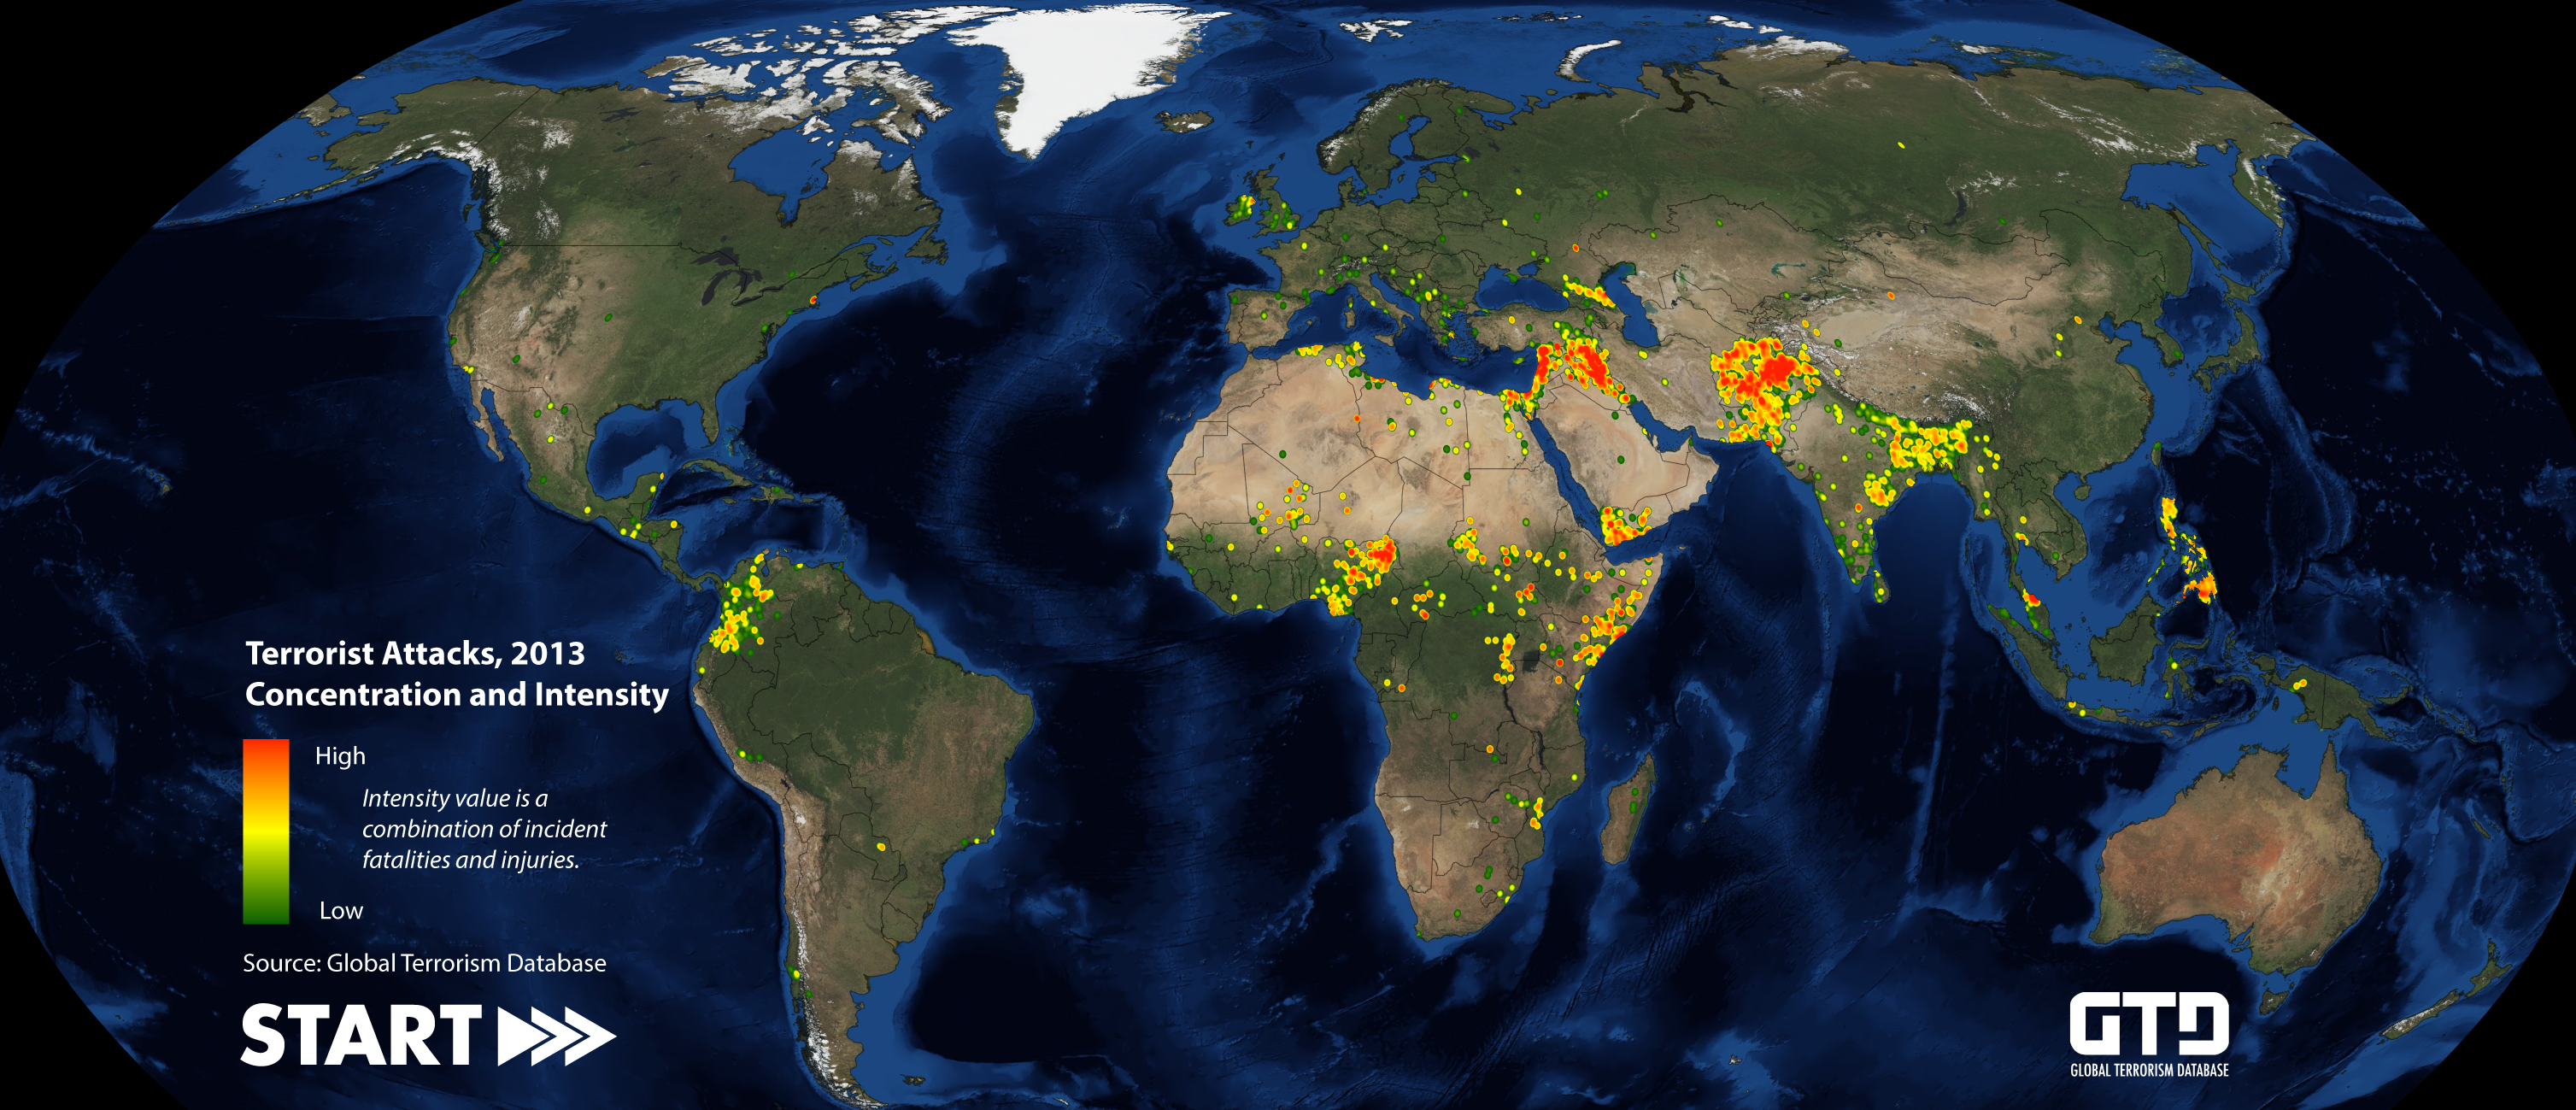
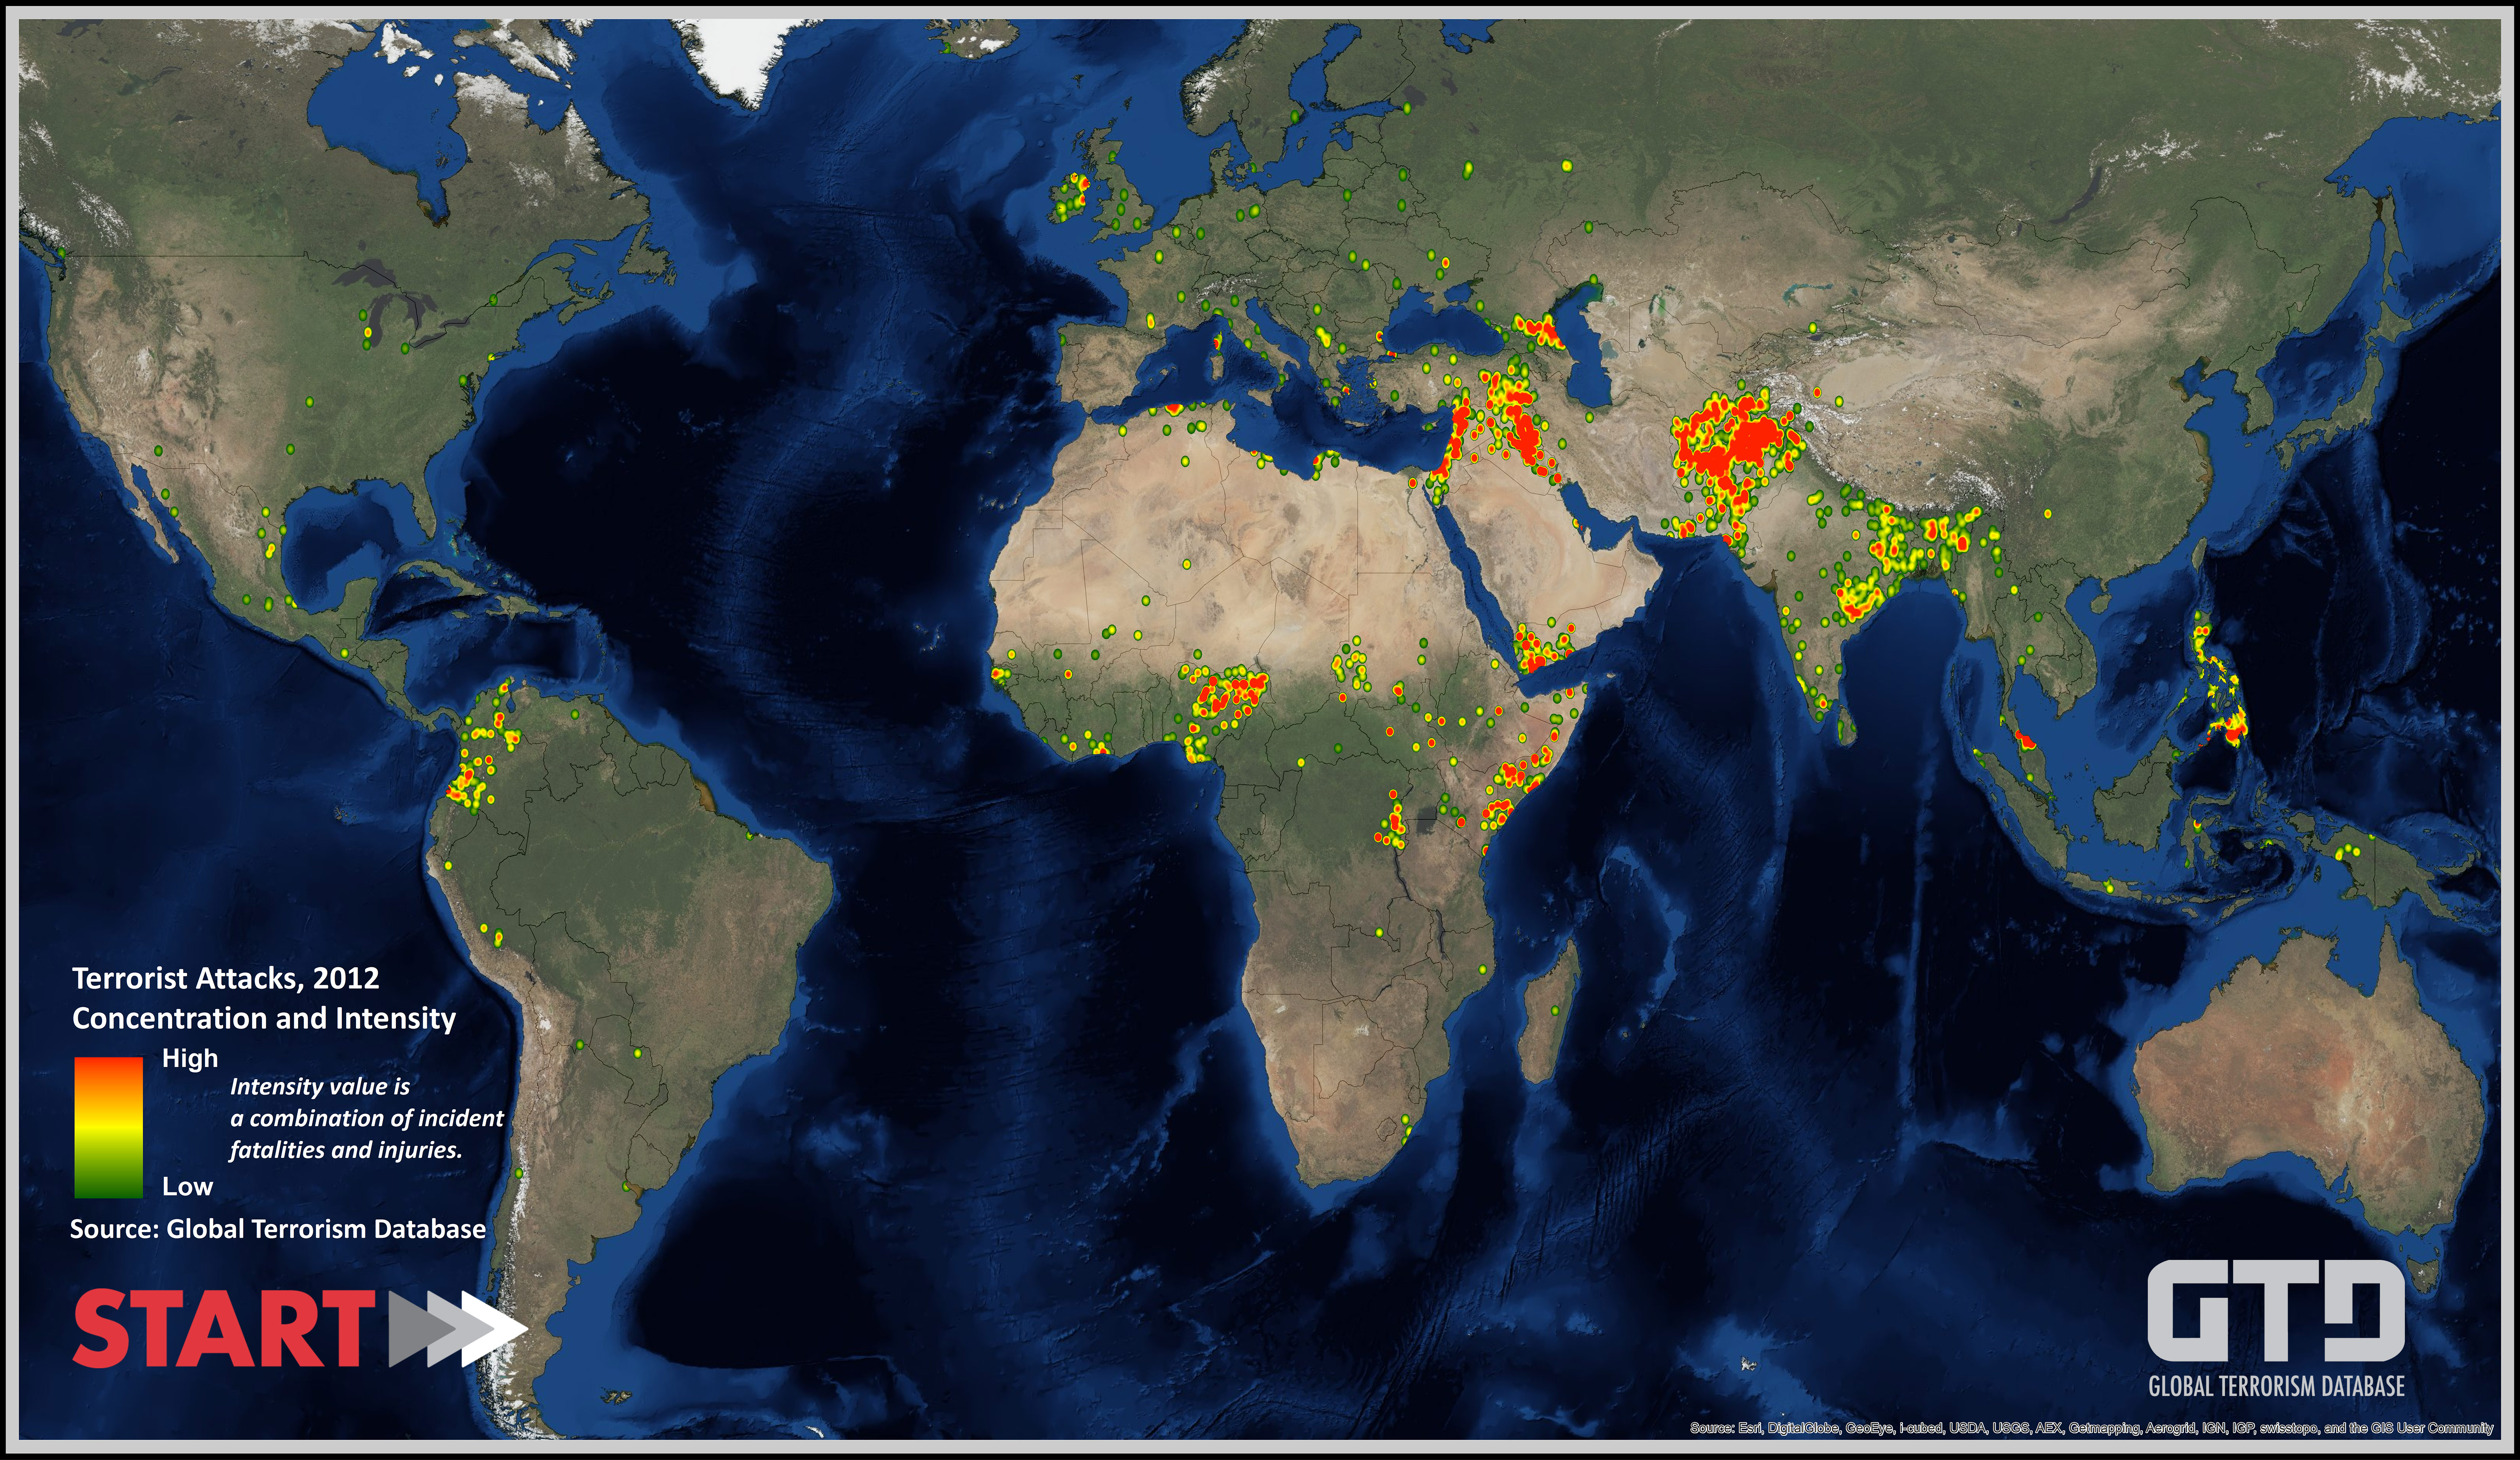
Global Terrorism Database Heat Maps
GTD heat maps show the geographic concentration and intensity of terrorist attacks that occurred worldwide that year. Intensity is calculated based on the number of people killed or injured in each attack.
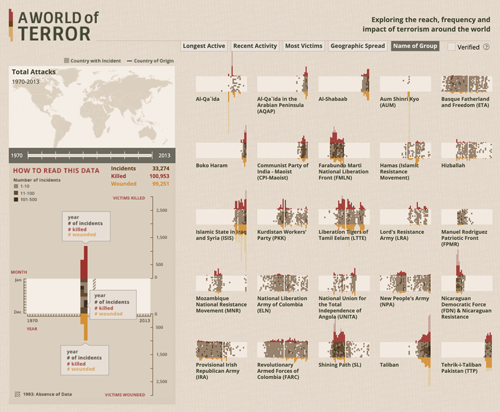
A World of Terror
Periscopic, a data visualization firm that promotes information transparency and public awareness, has produced an innovative, interactive tool that allows users to explore the impact and dynamics of GTD perpetrator groups. A World of Terror examines the 25 perpetrators that were most active between 1970 and 2013, visualizing their attack patterns across multiple dimensions including life span, recency, casualties, and geographic spread.

